![Opus1-3-icon-color-1.png]](https://kb.opus1.io/hs-fs/hubfs/Opus1-3-icon-color-1.png?height=50&name=Opus1-3-icon-color-1.png)
Last updated: August 28, 2026
Applies to: Owner / Manager / Staff |
Plan: Requires Advanced Reporting
Feature: Stats, Reporting
Table of Contents
- Overview
- What Opus1 Counts as Retention
- Comparing Retention Year Over Year
- Dashboard: The Subscription Retention Cards
- The Retention Report
- FAQ
- Related Articles
Overview
Retention tells you whether the students you had last month are still on the schedule this month. Looking at it across a year tells you something different and more useful: whether this September is better or worse than last September, and whether the dip you are worried about is a problem or just what August looks like at a music school.
Opus1 surfaces retention in two places. The Stats Dashboard carries retention cards on every plan and can compare the current rate against the same month a year ago. The Stats Retention report breaks retention down teacher by teacher across a range you choose, and requires Advanced Reporting.
The reason to watch retention at all is timing. Revenue lags churn — a family who quietly stops booking in March may not show up as lost income until their subscription lapses weeks later. Retention moves first, which gives you a window to make a phone call while the family is still reachable.
What Opus1 Counts as Retention
Read this before acting on any of the numbers, because Opus1's definition is narrower than most people assume.
A student or subscription counts for a given month if they appear on a booked calendar event that month with a subscription attached. Retention is a scheduling measure, not a billing one.
| Counted | Not counted |
|---|---|
| Booked on the calendar last month and this month, with a subscription on the event | Whether the invoice was paid |
| Whether attendance was marked present | |
| Whether the subscription was still active on the last day of the month, if no lessons were booked |
The practical consequence: a family who owes you money but keeps showing up counts as retained, and a family who is paid in full but has nothing on the calendar does not.
Families who leave and come back
If a family pauses and has no qualifying events in a month, they are counted as lost that month. When they return, they appear as gained — not as retained continuously through the gap.
This is why summer looks like a cliff at most schools. On the Retention report you can soften it with Include cancelled, which lets cancelled and hold events still count, so a month of holds does not read as mass churn.
Two things that move a number without a family leaving
- Teacher changes (Retention report only) — a student moving to a different primary teacher counts as lost for the old teacher and gained for the new one. School-wide nothing changed; two teachers' rows both moved.
- Subscription renewals (Dashboard only) — if a subscription renews under a new ID, the subscription-level rate still treats it as retained. The student-level rate follows the person rather than the subscription ID.
Comparing Retention Year Over Year
Why you'd use it
For an owner, a single month's retention rate is almost unreadable on its own. Music schools are seasonal — students stop in June and come back in September — so a rate that falls in July tells you nothing until you know what last July looked like. Comparing across a year is what separates a genuine problem from the annual pattern, and it is the difference between calling an emergency staff meeting in August and leaving it alone.
It also lets you check whether something you changed worked. If you introduced a new cancellation policy last fall, the honest test is this fall against last fall, not this month against last month.
Two ways to do it
Compare this month against the same month last year — on the Dashboard. At the top of the Stats Dashboard, set Compare displayed metrics to to Last Year. The retention cards then show the current rate alongside the rate recorded about twelve monthly snapshots earlier, with the change between them. This is the fastest way to answer "are we doing better than a year ago."
See a full year of monthly retention — on the Retention report. Set the date range to the 12-month preset and run the report. You get one column per month for every teacher, which shows you the whole seasonal cycle in one table: where the dips fall, how deep they go, and which teachers ride them out better than others.
💡 Tip: Use them together. The Dashboard tells you whether the number moved; the report tells you which months and which teachers moved it.
Seeing the same month in both years
The report's limit is 372 days — roughly 12 × 31 — rather than a fixed number of months. A run is rejected only when the end date falls more than 372 days after the start date, and the table shows one column for every calendar month your range touches, including both endpoints. That leaves just enough room for a 13th column if you set the dates yourself.
| Range you set | Days | What you get |
|---|---|---|
| Last 12 Months preset, run in August | ~364 | August last year through July this year — last August only |
| September last year → August 31st this year | ~364 | September through August — this August only |
| August 1st last year → around August 8th this year | Within 372 | Both Augusts — 13 columns |
| August 1st last year → August 31st this year | ~395 | Rejected — over the limit |
⚠️ Warning: The Last 12 Months preset never gives you two of the same month. It runs from the start of the month twelve months back through the end of last month, so you get one instance of each. To put August next to August you have to set the dates by hand and end within the first week or so of the second August.
What neither one does
Neither surface follows the same individual families from one year to the next. A cohort view — take the students enrolled last September and ask how many are still here — does not exist in Opus1, and the Retention report's CSV has no year-over-year columns.
The Dashboard's Last Year option compares two retention rates. If both years sat at 80%, that is a match even if the underlying families are entirely different people. For most purposes that is the number you want anyway, but it is worth knowing what you are looking at before you draw conclusions about loyalty.
⚠️ Warning: If your school has fewer than twelve months of Dashboard history, or the older snapshot has no rate stored, the Last Year comparison shows a dash rather than a number. Schools in their first year will not see a comparison at all.
Dashboard: The Subscription Retention Cards
What it does
Shows school-wide retention rates for the current calendar month against a comparison period you choose, split by booking type and by what is being counted.
Why you'd use it
This is the earliest warning you get. A rate that drops two months running tells you something is wrong while you can still act — before the cancellations arrive and before the revenue report confirms it. Splitting appointments from group classes also tells you where it is wrong, which is usually the difference between a teacher problem and a program problem.
How to open it
- Go to Stats → Dashboard
- Find the Subscriptions widget
There is no separate retention widget. Retention is four cards inside Subscriptions:
| Card | What it measures |
|---|---|
| Subscription Retention (Appt) | The same subscription still has private-lesson events this month |
| Subscription Retention (Group Classes) | The same subscription still has group class events |
| Subscriber Retention (Appt) | The same student still has private-lesson events, even if the subscription ID changed |
| Subscriber Retention (Group Classes) | The same student still has group class events |
Rates are calculated automatically from precomputed stats when the Dashboard loads. Each card compares this full calendar month against the comparison period — not month-to-date. Cancelled and on-hold events are always included here, with no toggle.
Setting the comparison period
Compare displayed metrics to defaults to Last Month, with options for 3 Months Ago, 6 Months Ago, and Last Year. The control applies to the whole Dashboard, not just retention.
Reading the change indicator
The large number is this month's rate. Beneath it, the comparison can show two figures, and they are not the same thing:
- Point change — this month's rate minus the older rate. From 70% to 80%, that is +10.
- Relative change — the difference measured against the older rate. From 70% to 80%, that is +14.3%.
Green up and red down follow the direction of the rate. Missing history shows a dash.
💡 Tip: Expand a card for the previous-period count, the retained count, and breakdowns by location, service name, service tag, and duration. There is no staff filter on these cards — for per-teacher numbers you need the Retention report.
You can hide or pin cards using the widget filters and My Key Metrics. Dashboard Export CSV can include these rates, but that export is Dashboard history rather than a student-level list.
The Retention Report
What it does
Breaks retention down teacher by teacher, month by month, across a range you choose, and estimates how long a typical student stays with each teacher.
Why you'd use it
The school-wide rate tells you something is happening; this tells you where. Retention is rarely evenly distributed — one teacher's students may leave at three times the rate of another's, and until you can see that per teacher it looks like a marketing problem rather than a coaching conversation. The average client lifetime figure also puts a number on what one enrollment is worth, which is what makes acquisition spend a decision rather than a guess.
ℹ️ Note: The Retention report is part of Advanced Reporting and is not enabled by default. Owners and Managers cannot switch it on themselves — email finance@opus1.io or contact your Opus1 representative, and Opus1 Support will enable it for your school. Without it, the page explains that Client Retention is a premium feature.
How to run it
The report does not load on its own. Set filters first, then run it.
- Go to Stats → Retention — the page is titled Client Retention
- Optionally select staff; leave empty for all teachers
- Set the date range. Presets cover the last 3, 6, and 12 months and quarters, or set your own start and end dates. A range cannot span more than 372 days
- Optionally turn on Include cancelled so cancelled lessons still count, which stops a month of holds from looking like churn
- Optionally limit to Group Classes only or Appointments only — not both at once
- Click load report
Whatever you set applies to every month in that run. If the report takes too long to finish on screen, Opus1 emails you a CSV instead.
What you see
At the top of the report you'll see summary metrics for your school as a whole, covering the full range you selected:
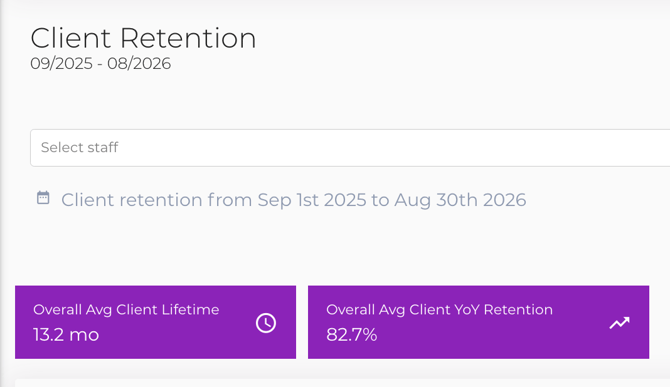
Average Client Lifetime — how long a typical student stays, in months. It is built from monthly churn: Opus1 works out a lifetime for each teacher in your range, then averages those figures. Because it rests on churn, it needs at least twelve months of range to mean much, and Opus1 warns you when your range is shorter. A teacher with almost no churn is left out of the average rather than shown as an enormous number.
Overall Average Client YoY Retention — shows how well your school is retaining clients year over year, giving you a high-level view of whether client retention is improving or declining over time.
These are school-wide figures. For a more detailed view that is teacher by teacher, select the staff member(s) you want to view. There will be one row per teacher, one column per month:
- Retention percentage against the previous calendar month
- All, gained, and lost clients, plus the net
- Gained and lost subscriptions, plus the net
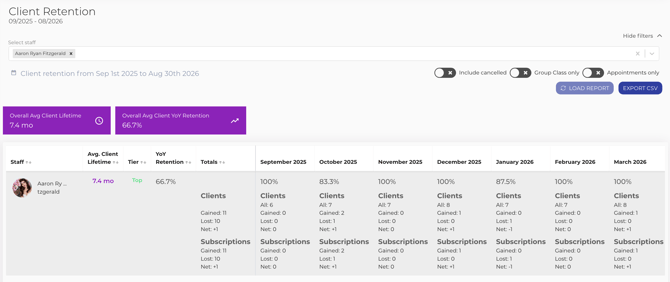
Hover any cell to see the student names behind it: 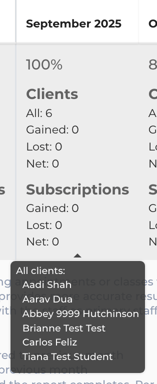
Avg. Client Lifetime is one divided by that teacher's average monthly churn. Tier rates each teacher Top, Mid, or Low against the school average for the range you selected.
⚠️ Warning: Lifetime needs at least 12 months of range to be meaningful, and the page warns you when your range is shorter — another reason to run the full twelve months. If churn is essentially zero, lifetime shows N/A rather than an enormous number.
A blank cell means there was nothing to compare against — most often the first month in your range, where there is no prior month. Blank is not zero and not an error.
Export
Export csv downloads the same month-by-month figures: staff, lifetime, tier, month, year, rate, and client and subscription counts.
FAQ
Q: How do I compare this year's retention to last year's?
A: On the Stats Dashboard, set Compare displayed metrics to Last Year. The retention cards will show the current rate against the rate from the same month a year earlier. For month-by-month detail across the year, run the Opus1 Retention report with the 12-month preset — though that preset shows one instance of each month, so it will not put this August beside last August. For that, set the dates manually within a 372-day span.
Q: Why does the Last Year comparison show a dash?
A: Opus1 needs about twelve months of Dashboard history to make the comparison. Schools in their first year, or any period where the older snapshot has no rate stored, will see a dash instead of a number.
Q: A family paid for the whole term but shows as lost. Why?
A: Retention in Opus1 counts booked lessons, not payments. If nothing was on the calendar for that student in a given month, they are counted as lost for that month regardless of what they have paid.
Q: Why does our retention collapse every summer?
A: Families on hold have no qualifying events, so they count as lost and then gained when they return. On the Retention report, turn on Include cancelled so cancelled and hold events still count and the summer months read more accurately. Comparing against the same month last year will also show you whether this summer is actually worse than usual.
Q: Why can't I open the Retention report?
A: It is part of Advanced Reporting, which is not on by default. Owners and Managers cannot enable it themselves — email finance@opus1.io or speak to your Opus1 contact, and Support will turn it on.
Q: One teacher's retention dropped but nobody left the school. What happened?
A: A student who switches to a different primary teacher counts as lost for the old teacher and gained for the new one. School-wide retention is unchanged; two teachers' rows both moved.
Related Articles
- Understanding the Stats Dashboard — what the other Dashboard widgets measure
- What's included in Advanced Reporting — the full set of premium reports
- Managing Subscriptions — how holds and renewals affect what appears on the calendar
- Cancellation Policies — how cancelled lessons are recorded, which feeds Include cancelled